
Skip to content
    ego (lite) is just a browser, ego is your personal agent across devices.Join waitlist
    Pricing
    Features/Website monitoring

    Know the moment your site stops behaving.

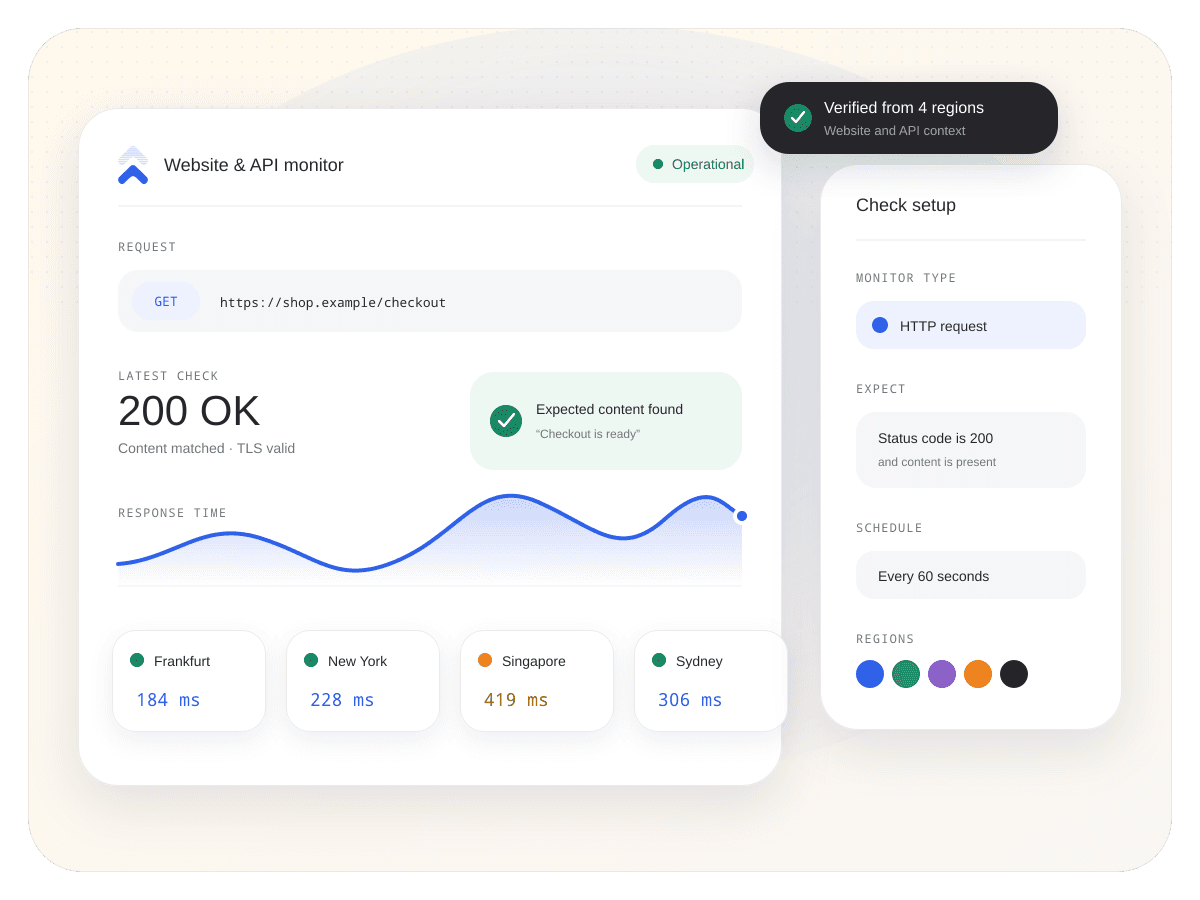
    Run website and API checks from multiple locations, then keep response, latency, content, SSL, DNS, and domain signals together.
    Start website monitoringOpen monitoring workspace
    Uptimus website monitor with regional response checks and latency chart
    CoverageMultiple regions

    Separate a local problem from a broad outage.

    ResponseHTTP + content

    Confirm the endpoint answered as expected.

    ContextOne timeline

    Keep failure, alert, and recovery connected.

    A successful request is useful. A useful page is better.

    Check more than reachability: validate the response your users need and keep regional evidence ready for the incident timeline.

    HTTP and API checks

    Ask the endpoint the question users care about.

    Check status codes, headers, response content, and latency for the pages and APIs that make the product usable.

    • Monitor websites and API endpoints from one workspace.
    • Validate expected content and response behavior.
    • Use SSL, DNS, domain, and Lighthouse checks where available by plan.
    WEBSITE CHECK Live context
    Continue through the product

    Status aggregation

    Normalize every provider into one view.

    Explore feature

    Fair questions. Straight answers.

    Yes. HTTP and API endpoints can be checked for response behavior, status, content, headers, and latency according to the monitor configuration.

    Yes. Regional checks help distinguish a local connectivity issue from a broader service problem.

    Yes. A monitor can validate expected response content or headers, so a technically successful but incorrect page does not have to look healthy.

    Those monitor capabilities exist in Uptimus, with availability and limits depending on the selected plan and monitor type.

    Check the response. Understand the impact.

    Monitor the pages and APIs your customers actually depend on.

    Start website monitoringView all features
    Uptimus

    Service monitoring, provider intelligence, and customer incident communication in one place.

    View system status

    Product

    Use casesFeaturesComparePricing

    Monitoring

    Status pagesCloud monitoringWebsite monitoringStatus aggregationPing monitoringIncidents

    Resources

    BlogLive statuses

    Company

    SupportPrivacyTerms
    © 2026 Uptimus
    Monitor first. Communicate clearly.
    https://shop.example/checkoutUptimus operational view
    Status code200 OKhealthy
    Expected textCheckout foundhealthy
    Response time842 mswarning
    Checked from Frankfurt Synced

    Regional evidence

    See where the request starts to fail.

    Compare location results without flattening a regional problem into one global red dot.

    • View response time and success by check location.
    • Confirm whether regions agree before escalating.
    • Attach the failing locations to the incident context.
    REGIONAL RESPONSE Live context
    Checkout API latencyUptimus operational view
    Frankfurt1,240 mswarning
    New YorkRequest faileddown
    Singapore318 mshealthy
    Two locations agree on impact Synced

    Failure to recovery

    Keep the alert and the recovery together.

    Turn each state change into a readable timeline so the team knows what failed, when alerts went out, and when the endpoint recovered.

    • Keep check failures and recoveries distinct.
    • Route notifications with the relevant result attached.
    • Review the event history without reconstructing it from chat.
    MONITOR HISTORY Live context
    shop.exampleUptimus operational view
    Content mismatch14:08 UTC
    Alert delivered14:09 UTC
    Response stable14:22 UTC
    Recovered14:24 UTC
    Incident duration 16 minutes Synced