
netflix.com
| Location | Response time |
|---|---|
Europe West LondonGoodUsually 170 ms | 170ms |
Europe West FrankfurtGoodUsually 210 ms | 212ms |
Asia Southeast SingaporeHigher than usualUsually 210 ms | 254ms |

Monitor your websites, APIs, and third-party services. Get alerts when something goes wrong.

 chatgpt.comIs ChatGPT down?
 github.comIs GitHub down?netflix.comIs Netflix down?
 facebook.comIs Facebook down?
A payment won’t go through. Your tools won’t load. Is it just you—or is the service down?
From the services you depend on to the websites and APIs you run, bring your monitoring into one place.
See how it works Stripe

 Cloudflare

Elevated error rates
Investigating failed requests.
GitHub AWS

EC2 host maintenance
Applying scheduled infrastructure updates.
· Ends
 DigitalOcean

Droplet connectivity outage
Investigating unreachable Droplets.
See what failed, when it started, and what your visitors saw. Keep the incident details together while you investigate.
Explore incidentsEvery signal tells a story.
Pages loaded. Everything looked good.
Unusual responses detected.


Monitor websites and APIs from around the world. Verify responses, track latency, and get notified when something breaks.
Explore monitoring| Location | Response time |
|---|---|
| Europe WestLondonGoodUsually 170 ms | 170ms |
| Europe WestFrankfurtGoodUsually 210 ms | 212ms |
| Asia SoutheastSingaporeHigher than usualUsually 210 ms | 254ms |
SSL certificate

Know before it expires.
Valid certificate
Checked
Lighthouse report

A better experience starts here.

Less code. A faster first impression.
Sitemap report
 /sitemap.xml
/HTTP 200/aboutHTTP 200/contactHTTP 200/old-pageHTTP 404/old-page returned “Not found”. Update the URL or remove it from your sitemap.
DNS lookup
 Cloudflare
A Website address
192.0.2.10Answered in 8 msA secure connection starts with a healthy certificate. Check who issued yours, when it expires, and how much time you have left.
Check SSLSee what slows your website down. Lighthouse brings performance, accessibility, best practices, and SEO into one clear report—with the details that help you improve.
Open monitoringYour sitemap tells a story. Make sure every page belongs in it. Review your URLs and spot broken pages before they become someone’s next stop.
Open workspaceYour website. Your email. It all starts with DNS. See where your records point and compare answers across DNS servers, without digging through the details yourself.
Look up DNSEmail, SMS, push notifications and your team’s favorite apps. Choose your channels. Keep everyone in the loop.
Set up alertsUpdates in your inbox.
Text alerts to your verified phone.
Notifications in the Android app.
Alerts in your browser.
Alerts in your team channels.
Keep your server informed.
Updates in your chats.

Send events to your own tools.
SMS requires a paid plan, a verified phone number and available credits. Channel availability depends on your plan and settings.
Know what happened, which service is affected, and when it recovers. Get the details in the channels you choose.
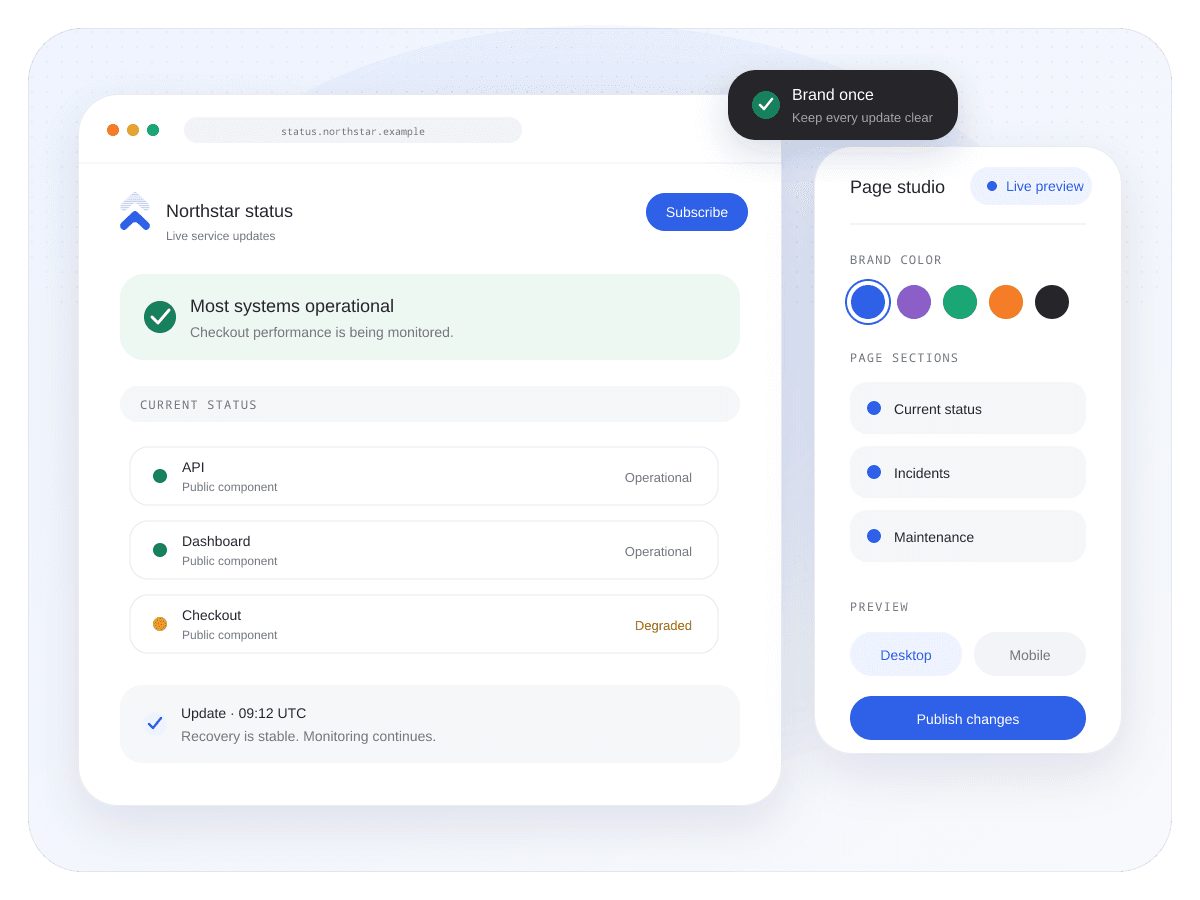
Choose your channelsSlack# service-alertsEmailTelegramUptimus botGive customers a clear view of service health, incidents and planned maintenance. All on a status page that feels like your brand.

Some systems are experiencing issues
 Operational

 Operational

 Degraded performance

Use your logo and colors so your status page feels like part of your product.
Show your monitors and the providers behind your product in one public view.
Share incident, maintenance and recovery updates with clear timestamps.
Give customers an opt-in way to follow status changes.
Payments. Cloud. Collaboration. Keep an eye on the third-party services your business runs on.
StripeCloudflareGitHubAWSDigitalOceanOpenAIWe collect updates from official provider status pages, bringing incidents, maintenance, and recovery into one place.
Their updates. One clear view.
Payment processing · Operational
Network · Investigating
Git operations · Resolved
Official updates collectedOfficial updates are one part of the story. People tell the other. Reports from around the world help reveal what it feels like to use a service, right now.
Follow the signalsLoading globe…
Public conversations and community reports add context. Our Early Signals algorithm looks for unusual activity that may point to a problem.

Is anyone else having trouble signing in?

Requests keep timing out.
The service won’t load.
Unusual activity detected
An early signal, not an official confirmation.
Keep websites, APIs, and providers in view. Get the context you need when something changes.
Start monitoringGive customers a clear status page and keep them informed through every incident.
Explore status pages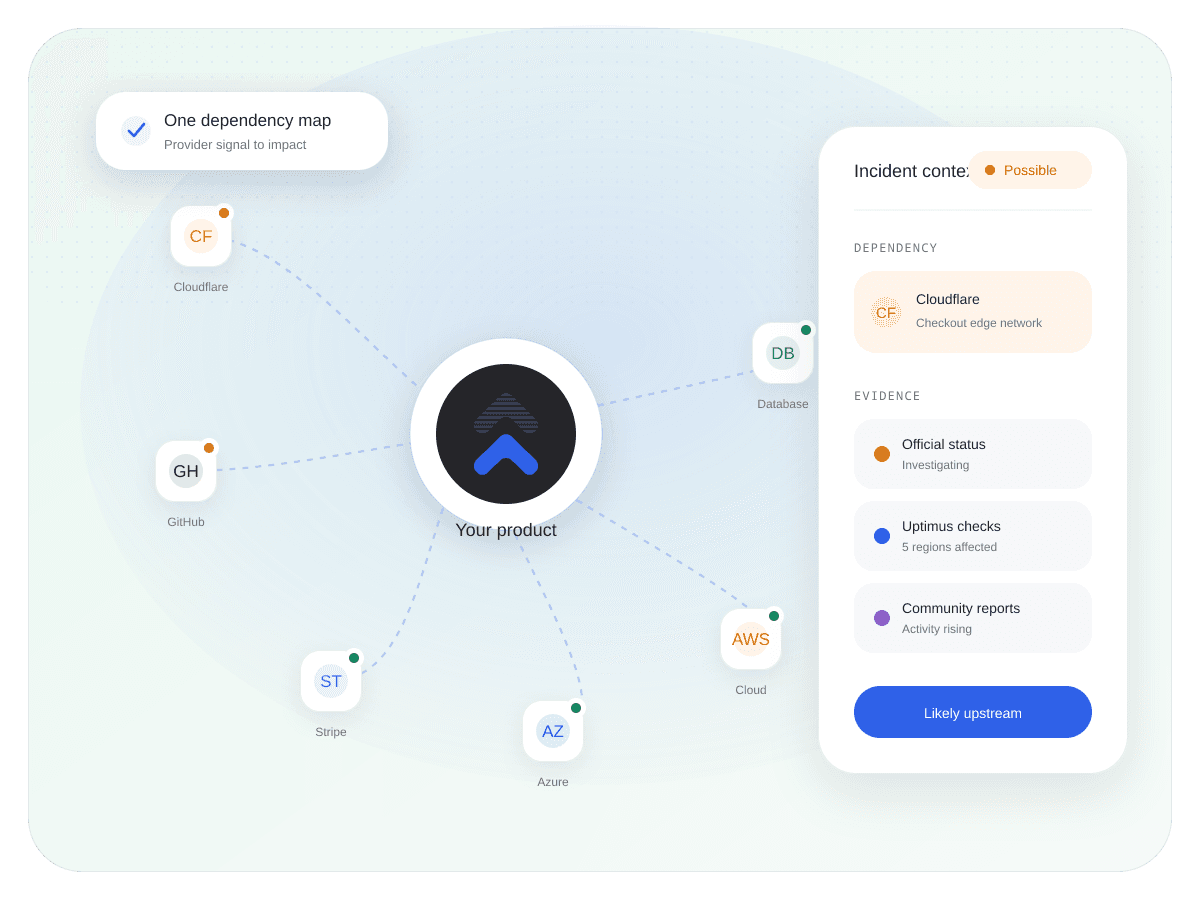
 200 OKResponse verifiedOperational
 All clear.Keep customers informedUpdates in one place
Your own services. The providers you rely on. One place to see what is happening.
Keep an eye on availability and response times. See how your websites and endpoints perform across monitoring regions.
Follow the cloud platforms and services behind your business. Bring their status updates into the same view as your own monitors.

Set up available alert channels in your workspace and receive updates when a monitored service needs attention.
Keep the timeline, affected services and latest updates together. Give your team and your customers a clear picture of what is happening.
Keep certificate and domain expiry dates in view alongside your website checks. Stay aware of the details your service depends on.
Organize your monitors, followed services and status pages in a shared workspace. Bring the right context into every conversation.
Loading plans…
Official provider updates, uptime checks and community reports come together in one provider feed.
Send incident alerts to email, Slack, Discord and the other channels available on your plan. Follow the services and monitors that matter to your team.
Publish uptime, incidents and maintenance on a branded status page. Let customers subscribe to the updates that matter to them.
Bring the first signal, affected services and provider updates together in one timeline, so your team can investigate and keep customers informed.
Monitor your services, follow your providers, and keep customers informed. Bring your next incident into focus with Uptimus.


Start with a small project or bring more of your business into view. These plans are billed monthly.
Always available
$0/ month
Great for small teams and growing projects
$18.99/ month
Most popular choice for power users who follow multiple services and need reliable notifications
$49/ month
Enterprise-ready solution
$99/ month